El Modelo Macroeconómico IS-LM
Contents
import ipympl
%matplotlib widget
%matplotlib inline
import ipywidgets as widgets
import matplotlib.pyplot as plt
import numpy as np
import sympy as sy
from sympy import *
import pandas as pd
from causalgraphicalmodels import CausalGraphicalModel
import os
os.environ["PATH"] += os.pathsep + 'C:/Program Files/Graphviz/bin/'
from IPython.display import Image
import warnings
warnings.filterwarnings('ignore')
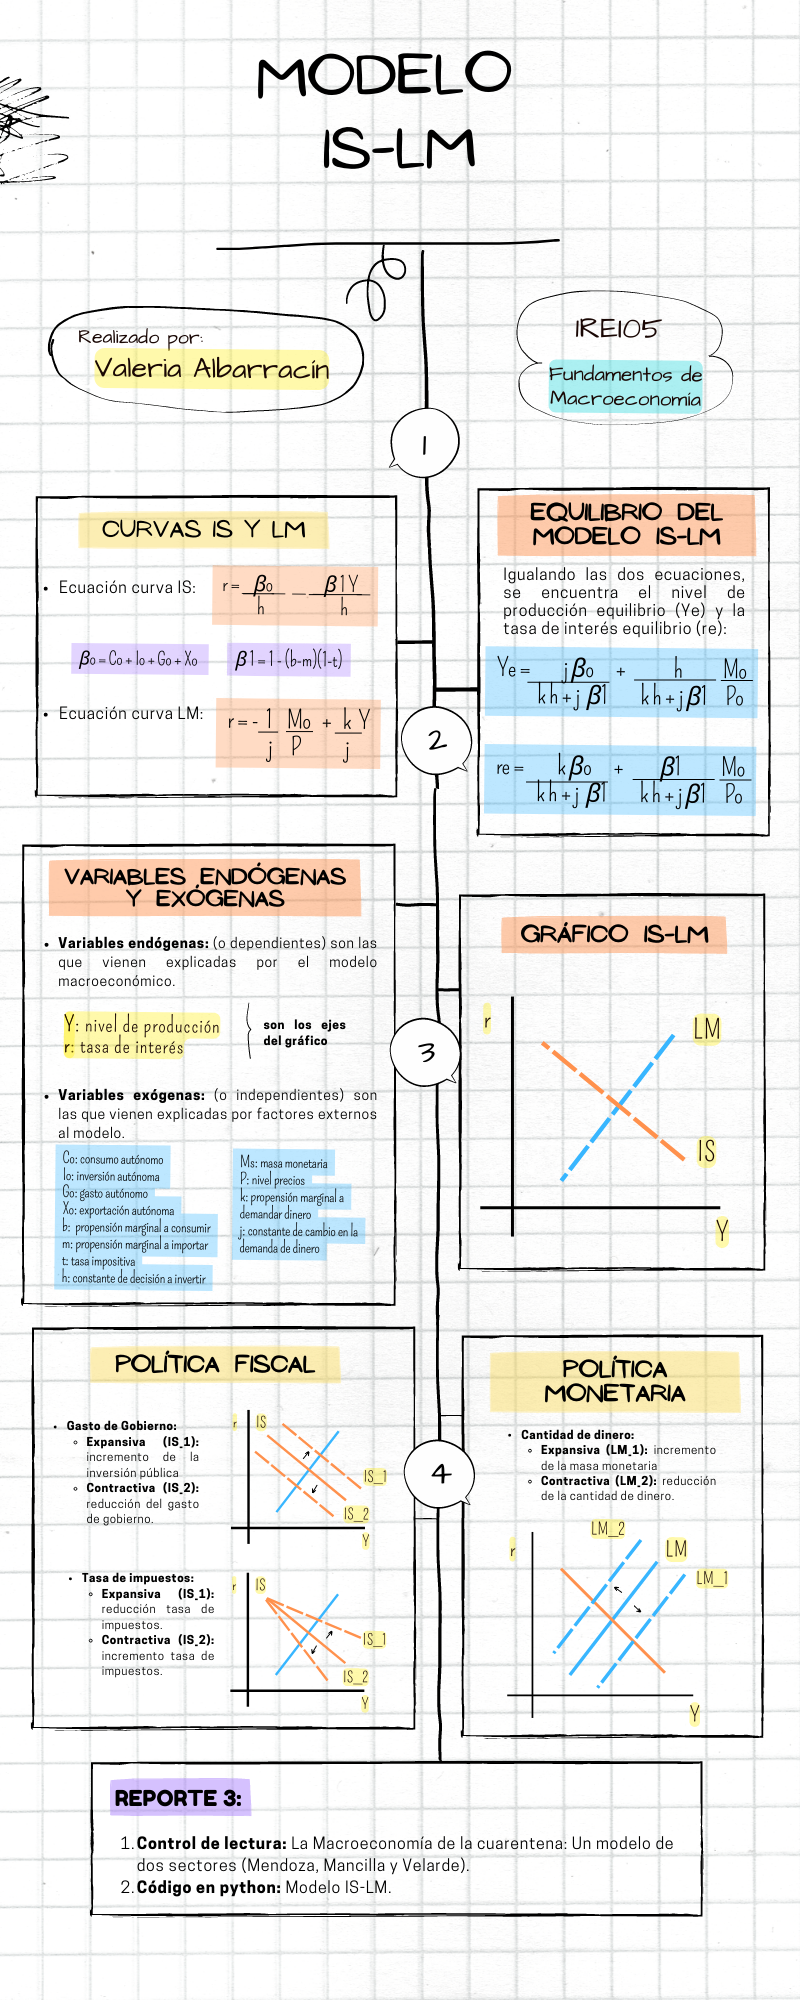
4. El Modelo Macroeconómico IS-LM#
Image('tutorial5.png')
4.1. ¿Cómo son las pendientes de las curvas IS-LM?#
#--------------------------------------------------
    # Curva IS

# Parámetros

Y_size = 100

Co = 35
Io = 40
Go = 50
Xo = 2
h = 0.8
b = 0.4
m = 0.5
t = 0.8

Y = np.arange(Y_size)


# Ecuación
def r_IS(b, m, t, Co, Io, Go, Xo, h, Y):
    r_IS = (Co + Io + Go + Xo)/h - ( ( 1-(b-m)*(1-t) ) / h)*Y
    return r_IS

r_is = r_IS(b, m, t, Co, Io, Go, Xo, h, Y)


#--------------------------------------------------
    # Curva LM

# Parámetros

Y_size = 100

k = 2
j = 1
Ms = 200
P  = 20

Y = np.arange(Y_size)

# Ecuación

def r_LM(k, j, Ms, P, Y):
    r_LM = - (1/j)*(Ms/P) + (k/j)*Y
    return r_LM

r_lm = r_LM( k, j, Ms, P, Y)
# Primero declarar los simbolos
Co, Io, Go, Xo, h, r, b, m, t, Y = symbols('Co Io Go Xo h r b m t Y')

# Ecuacion de la curva IS
r_eq_is = (Co + Io + Go + Xo)/h - ( ( 1-(b-m)*(1-t) ) / h)*Y

# tomar diferenciales
df_r_eq_is_y = diff(r_eq_is, Y)

print("La pendiente de la curva IS es", df_r_eq_is_y)  # este diferencial es positivo
La pendiente de la curva IS es -(-(1 - t)*(b - m) + 1)/h
# Declaren todos los parametros de la curva lm como simbolos
k, j, Ms, P, Y = symbols('k j Ms P Y')

# Escribir la ecuacion de la LM
r_eq_lm = - (1/j)*(Ms/P) + (k/j)*Y

# TOMAR el diferencial
df_r_eq_lm_y = diff(r_eq_lm, Y)
print("La pendiente de la curva IS es", df_r_eq_lm_y)  # este diferencial es positivo
La pendiente de la curva IS es k/j
4.2. El equilibrio en el Modelo IS-LM#
Por un lado, considerando la ecuación de la curva IS
Donde \( B_0 = C_o + I_o + G_o + X_o \) y \( B_1 = 1 - (b - m)(1 - t) \)
Y, por otro lado, la ecuación de la curva LM:
Podemos igualar, sustituir o reducir ambas ecuaciones para encontrar el nivel de Ingresos equilibrio \((Y^e)\) y la tasa de interés de equilibrio \((r^e)\):
Ingreso de equilibrio:
Tasa de interés de equilibrio:
Estas dos ecuaciones representan el modelo IS-LM
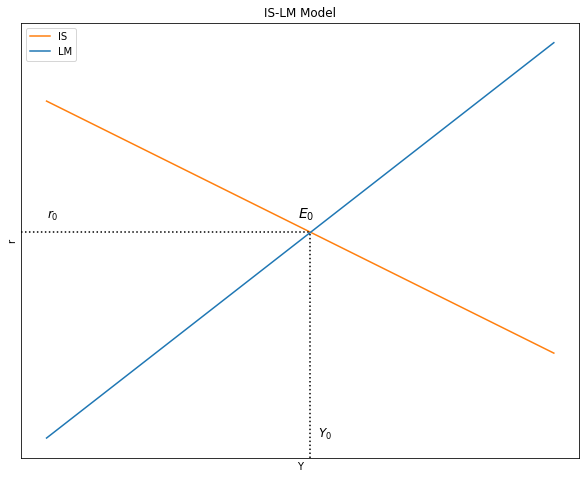
4.2.1. Gráfico del equilibrio en el Modelo IS-LM#
#--------------------------------------------------
    # Curva IS

# Parámetros

Y_size = 100

Co = 35
Io = 40
Go = 50
Xo = 2
h = 0.8
b = 0.4
m = 0.5
t = 0.8

Y = np.arange(Y_size)


# Ecuación
def r_IS(b, m, t, Co, Io, Go, Xo, h, Y):
    r_IS = (Co + Io + Go + Xo)/h - ( ( 1-(b-m)*(1-t) ) / h)*Y
    return r_IS

r_is = r_IS(b, m, t, Co, Io, Go, Xo, h, Y)


#--------------------------------------------------
    # Curva LM

# Parámetros

Y_size = 100

k = 2
j = 1
Ms = 200
P  = 20

Y = np.arange(Y_size)

# Ecuación

def r_LM(k, j, Ms, P, Y):
    r_LM = - (1/j)*(Ms/P) + (k/j)*Y
    return r_LM

r_lm = r_LM( k, j, Ms, P, Y)
# Gráfico del modelo IS-LM

# Dimensiones del gráfico
y_max = np.max(r_lm)
fig, ax = plt.subplots(figsize=(10, 8))

# Curvas a graficar
# Curva IS
ax.plot(Y, r_is, label = "IS", color = "C1") #IS
# Curva LM
ax.plot(Y, r_lm, label="LM", color = "C0")  #LM

# Eliminar las cantidades de los ejes
ax.yaxis.set_major_locator(plt.NullLocator())
ax.xaxis.set_major_locator(plt.NullLocator())

# Texto y figuras agregadas
# Graficar la linea horizontal - r
plt.axvline(x=51.5,  ymin= 0, ymax= 0.52, linestyle = ":", color = "black")
# Grafica la linea vertical - Y
plt.axhline(y=93, xmin= 0, xmax= 0.52, linestyle = ":", color = "black")

# Plotear los textos
plt.text(49,100, '$E_0$', fontsize = 14, color = 'black')
plt.text(0,100, '$r_0$', fontsize = 12, color = 'black')
plt.text(53,-10, '$Y_0$', fontsize = 12, color = 'black')

# Título, ejes y leyenda
ax.set(title="IS-LM Model", xlabel= r'Y', ylabel= r'r')
ax.legend()

plt.show()
4.2.2. Ecuaciones de equilibrio#
# Beta_0 y beta_1
beta_0 = (Co + Io + Go + Xo)
beta_1 = ( 1-(b-m)*(1-t) )

# Producto de equilibrio y la tasa de interes de equilibrio en el modelo IS-LM
Y_eq = (k*beta_0)/(k*h + j*beta_1) - ( beta_1 / (k*h + j*beta_1) )*(Ms/P)
r_eq = (j*beta_0)/(k*h + j*beta_1) + ( h / (k*h + j*beta_1) )*(Ms/P)
4.3. Estática comparativa#
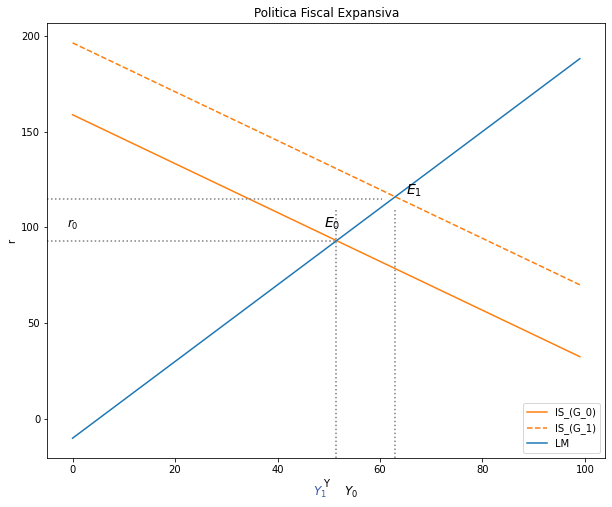
4.3.1. Política Fiscal Expansiva:#
Mercado de Bienes $\( Go↑ → DA↑ → DA>Y → Y↑ \)$
Mercado de dinero $\( Y↑ → Md↑ → Md>Ms → r↑ \)$
Matemática:
# nombrar variables como símbolos
Co, Io, Go, Xo, h, r, b, m, t, beta_0, beta_1  = symbols('Co Io Go Xo h r b m t beta_0, beta_1')

# nombrar variables como símbolos
k, j, Ms, P, Y = symbols('k j Ms P Y')

# Beta_0 y beta_1
beta_0 = (Co + Io + Go + Xo)
beta_1 = ( 1-(b-m)*(1-t) )

# Producto de equilibrio y la tasa de interes de equilibrio en el modelo IS-LM
r_eq = (k*beta_0)/(k*h + j*beta_1) - ( beta_1 / (k*h + j*beta_1) )*(Ms/P)
Y_eq = (j*beta_0)/(k*h + j*beta_1) + ( h / (k*h + j*beta_1) )*(Ms/P)
df_Y_eq_Go = diff(Y_eq, Go)
print("El Diferencial del Producto con respecto al diferencial del gasto autonomo = ", df_Y_eq_Go)  # este diferencial es positivo
El Diferencial del Producto con respecto al diferencial del gasto autonomo = j/(h*k + j*(-(1 - t)*(b - m) + 1))
df_r_eq_Go = diff(r_eq, Go)
print("El Diferencial de la tasa de interes con respecto al diferencial del gasto autonomo = ", df_r_eq_Go)  # este diferencial es positivo
El Diferencial de la tasa de interes con respecto al diferencial del gasto autonomo = k/(h*k + j*(-(1 - t)*(b - m) + 1))
Grafica:
#1--------------------------------------------------
    # Curva IS ORIGINAL

# Parámetros

Y_size = 100

Co = 35
Io = 40
Go = 50
Xo = 2
h = 0.8
b = 0.4
m = 0.5
t = 0.8

Y = np.arange(Y_size)


# Ecuación
def r_IS(b, m, t, Co, Io, Go, Xo, h, Y):
    r_IS = (Co + Io + Go + Xo - Y * (1-(b-m)*(1-t)))/h
    return r_IS

r = r_IS(b, m, t, Co, Io, Go, Xo, h, Y)


#2--------------------------------------------------
    # Curva LM ORIGINAL

# Parámetros

Y_size = 100

k = 2
j = 1
Ms = 200
P  = 20

Y = np.arange(Y_size)

# Ecuación

def i_LM( k, j, Ms, P, Y):
    i_LM = (-Ms/P)/j + k/j*Y
    return i_LM

i = i_LM( k, j, Ms, P, Y)
#--------------------------------------------------
    # NUEVA curva IS: reducción Gasto de Gobienro (Go)

# Definir SOLO el parámetro cambiado
Go = 80

# Generar la ecuación con el nuevo parámetro
def r_IS(b, m, t, Co, Io, Go, Xo, h, Y):
    r_IS = (Co + Io + Go + Xo - Y * (1-(b-m)*(1-t)))/h
    return r_IS

r_G = r_IS(b, m, t, Co, Io, Go, Xo, h, Y)
# Gráfico

# Dimensiones del gráfico
y_max = np.max(i)
fig, ax = plt.subplots(figsize=(10, 8))

# Curvas a graficar
ax.plot(Y, r, label = "IS_(G_0)", color = "C1") #IS_orginal
ax.plot(Y, r_G, label = "IS_(G_1)", color = "C1", linestyle = 'dashed') #IS_modificada

ax.plot(Y, i, label="LM", color = "C0")  #LM_original

# Texto y figuras agregadas
plt.axvline(x=51.5,  ymin= 0, ymax= 0.57, linestyle = ":", color = "grey")
plt.axhline(y=93, xmin= 0, xmax= 0.52, linestyle = ":", color = "grey")

plt.axvline(x=63,  ymin= 0, ymax= 0.57, linestyle = ":", color = "grey")
plt.axhline(y=115, xmin= 0, xmax= 0.6, linestyle = ":", color = "grey")
plt.text(65,117, '$E_1$', fontsize = 14, color = 'black')

plt.text(49,100, '$E_0$', fontsize = 14, color = 'black')
plt.text(-1,100, '$r_0$', fontsize = 12, color = 'black')
plt.text(53,-40, '$Y_0$', fontsize = 12, color = 'black')
#plt.text(50,52, '$E_1$', fontsize = 14, color = '#3D59AB')
#plt.text(-1,72, '$r_1$', fontsize = 12, color = '#3D59AB')
plt.text(47,-40, '$Y_1$', fontsize = 12, color = '#3D59AB')

#plt.text(69, 115, '→', fontsize=15, color='grey')
#plt.text(69, 52, '←', fontsize=15, color='grey')

# Título, ejes y leyenda
ax.set(title="Politica Fiscal Expansiva", xlabel= r'Y', ylabel= r'r')
ax.legend()

plt.show()
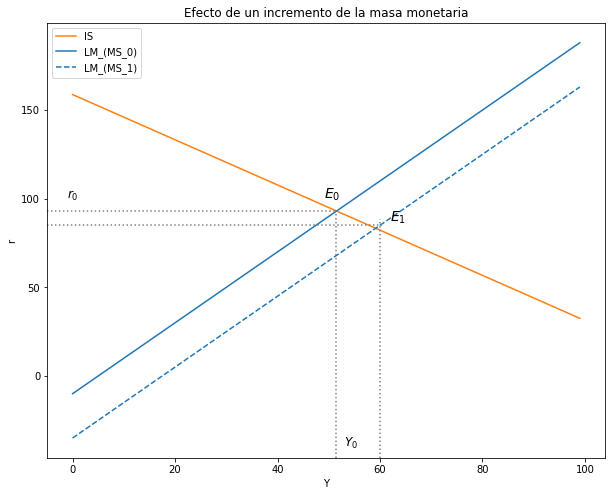
4.3.2. Política Monetaria Expansiva#
Mercado de dinero $\( Ms↑ → M^o↑ → M^o > M^d → r↓ \)$
Mercado de Bienes $\( r↓ → I↑ → DA>Y → Y↑ \)$
# nombrar variables como símbolos
Co, Io, Go, Xo, h, r, b, m, t, beta_0, beta_1  = symbols('Co Io Go Xo h r b m t beta_0, beta_1')

# nombrar variables como símbolos
k, j, Ms, P, Y = symbols('k j Ms P Y')

# Beta_0 y beta_1
beta_0 = (Co + Io + Go + Xo)
beta_1 = ( 1-(b-m)*(1-t) )

# Producto de equilibrio y la tasa de interes de equilibrio en el modelo IS-LM
Y_eq = (k*beta_0)/(k*h + j*beta_1) - ( beta_1 / (k*h + j*beta_1) )*(Ms/P)
r_eq = (j*beta_0)/(k*h + j*beta_1) + ( h / (k*h + j*beta_1) )*(Ms/P)
df_r_eq_Ms = diff(r_eq, Ms)
print("El Diferencial de la tasa de interes con respecto al diferencial de la masa monetaria = ", df_r_eq_Ms)  # este diferencial es positivo
El Diferencial de la tasa de interes con respecto al diferencial de la masa monetaria = h/(P*(h*k + j*(-(1 - t)*(b - m) + 1)))
df_Y_eq_Ms = diff(Y_eq, Ms)
print("El Diferencial del producto con respecto al diferencial de la masa monetaria = ", df_Y_eq_Ms)  # este diferencial es positivo
El Diferencial del producto con respecto al diferencial de la masa monetaria = -(-(1 - t)*(b - m) + 1)/(P*(h*k + j*(-(1 - t)*(b - m) + 1)))
#1--------------------------------------------------
    # Curva IS ORIGINAL

# Parámetros

Y_size = 100

Co = 35
Io = 40
Go = 50
Xo = 2
h = 0.8
b = 0.4
m = 0.5
t = 0.8

Y = np.arange(Y_size)


# Ecuación
def r_IS(b, m, t, Co, Io, Go, Xo, h, Y):
    r_IS = (Co + Io + Go + Xo - Y * (1-(b-m)*(1-t)))/h
    return r_IS

r = r_IS(b, m, t, Co, Io, Go, Xo, h, Y)


#2--------------------------------------------------
    # Curva LM ORIGINAL

# Parámetros

Y_size = 100

k = 2
j = 1
Ms = 200
P  = 20

Y = np.arange(Y_size)

# Ecuación

def i_LM( k, j, Ms, P, Y):
    i_LM = (-Ms/P)/j + k/j*Y
    return i_LM

i = i_LM( k, j, Ms, P, Y)
# Definir SOLO el parámetro cambiado
Ms = 700

# Generar nueva curva LM con la variacion del Ms
def i_LM_Ms( k, j, Ms, P, Y):
    i_LM = (-Ms/P)/j + k/j*Y
    return i_LM

i_Ms = i_LM_Ms( k, j, Ms, P, Y)
# Gráfico

# Dimensiones del gráfico
y_max = np.max(i)
fig, ax = plt.subplots(figsize=(10, 8))

# Curvas a graficar
ax.plot(Y, r, label = "IS", color = "C1") #IS_orginal
ax.plot(Y, i, label="LM_(MS_0)", color = "C0")  #LM_original

ax.plot(Y, i_Ms, label="LM_(MS_1)", color = "C0", linestyle = 'dashed')  #LM_modificada

# Lineas de equilibrio_0
plt.axvline(x=51.5,  ymin= 0, ymax= 0.57, linestyle = ":", color = "grey")
plt.axhline(y=93, xmin= 0, xmax= 0.52, linestyle = ":", color = "grey")

# Lineas de equilibrio_1
plt.axvline(x=60,  ymin= 0, ymax= 0.55, linestyle = ":", color = "grey")
plt.axhline(y=85, xmin= 0, xmax= 0.6, linestyle = ":", color = "grey")
plt.text(62,87, '$E_1$', fontsize = 14, color = 'black')

#plt.axhline(y=68, xmin= 0, xmax= 0.52, linestyle = ":", color = "grey")

# Textos ploteados
plt.text(49,100, '$E_0$', fontsize = 14, color = 'black')
plt.text(-1,100, '$r_0$', fontsize = 12, color = 'black')
plt.text(53,-40, '$Y_0$', fontsize = 12, color = 'black')
#plt.text(50,52, '$E_1$', fontsize = 14, color = '#3D59AB')
#plt.text(-1,72, '$r_1$', fontsize = 12, color = '#3D59AB')
#plt.text(47,-40, '$Y_1$', fontsize = 12, color = '#3D59AB')

#plt.text(69, 115, '→', fontsize=15, color='grey')
#plt.text(69, 52, '←', fontsize=15, color='grey')

# Título, ejes y leyenda
ax.set(title="Efecto de un incremento de la masa monetaria", xlabel= r'Y', ylabel= r'r')
ax.legend()

plt.show()
4.4. Ejercicios#
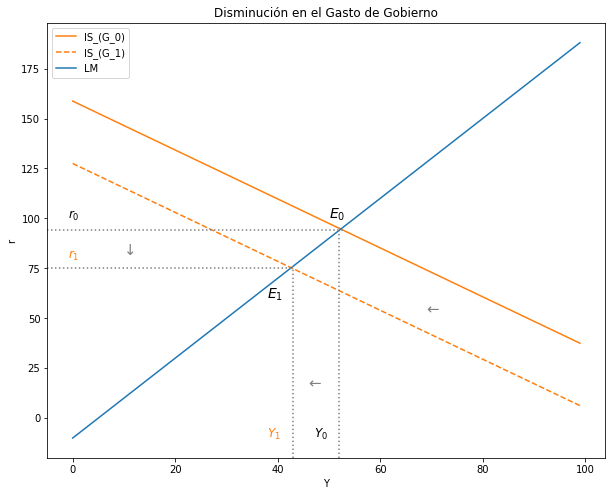
4.4.1. Analice los efectos sobre las variables endógenas a partir de una disminución del gasto fiscal \((∆G_0 < 0)\)#
Intuición:
Matemática:
# nombrar variables como símbolos
Co, Io, Go, Xo, h, r, b, m, t, beta_0, beta_1  = symbols('Co Io Go Xo h r b m t beta_0, beta_1')

# nombrar variables como símbolos
k, j, Ms, P, Y = symbols('k j Ms P Y')

# Beta_0 y beta_1
beta_0 = (Co + Io + Go + Xo)
beta_1 = ( 1-(b-m)*(1-t) )

# Producto de equilibrio y la tasa de interes de equilibrio en el modelo IS-LM
r_eq = (k*beta_0)/(k*h + j*beta_1) - ( beta_1 / (k*h + j*beta_1) )*(Ms/P)
Y_eq = (j*beta_0)/(k*h + j*beta_1) + ( h / (k*h + j*beta_1) )*(Ms/P)
df_Y_eq_Go = diff(Y_eq, Go)
print("El Diferencial del Producto con respecto al diferencial del gasto autónomo = ", df_Y_eq_Go)  # este diferencial es positivo
El Diferencial del Producto con respecto al diferencial del gasto autónomo = j/(h*k + j*(-(1 - t)*(b - m) + 1))
¿\(∆Y\) sabiendo que \(∆G_0 < 0\)?
df_r_eq_Go = diff(r_eq, Go)
print("El Diferencial de la tasa de interés con respecto al diferencial del gasto autónomo = ", df_r_eq_Go)  # este diferencial es positivo
El Diferencial de la tasa de interés con respecto al diferencial del gasto autónomo = k/(h*k + j*(-(1 - t)*(b - m) + 1))
¿\(∆r\) sabiendo que \(∆G_0 < 0\)?
Gráfico:
#1--------------------------------------------------
    # Curva IS ORIGINAL

# Parámetros

Y_size = 100

Co = 35
Io = 40
Go = 50
Xo = 2
h = 0.8
b = 0.5
m = 0.4
t = 0.8

Y = np.arange(Y_size)


# Ecuación
def r_IS(b, m, t, Co, Io, Go, Xo, h, Y):
    r_IS = (Co + Io + Go + Xo - Y * (1-(b-m)*(1-t)))/h
    return r_IS

r = r_IS(b, m, t, Co, Io, Go, Xo, h, Y)


#2--------------------------------------------------
    # Curva LM ORIGINAL

# Parámetros

Y_size = 100

k = 2
j = 1
Ms = 200
P  = 20

Y = np.arange(Y_size)

# Ecuación

def i_LM( k, j, Ms, P, Y):
    i_LM = (-Ms/P)/j + k/j*Y
    return i_LM

i = i_LM( k, j, Ms, P, Y)
#--------------------------------------------------
    # NUEVA curva IS: reducción Gasto de Gobienro (Go)

# Definir SOLO el parámetro cambiado
Go = 25

# Generar la ecuación con el nuevo parámetro
def r_IS(b, m, t, Co, Io, Go, Xo, h, Y):
    r_IS = (Co + Io + Go + Xo - Y * (1-(b-m)*(1-t)))/h
    return r_IS

r_G = r_IS(b, m, t, Co, Io, Go, Xo, h, Y)
# Gráfico

# Dimensiones del gráfico
y_max = np.max(i)
fig, ax = plt.subplots(figsize=(10, 8))

# Curvas a graficar
ax.plot(Y, r, label = "IS_(G_0)", color = "C1") #IS_orginal
ax.plot(Y, r_G, label = "IS_(G_1)", color = "C1", linestyle = 'dashed') #IS_modificada

ax.plot(Y, i, label="LM", color = "C0")  #LM_original

# Texto y figuras agregadas
plt.axvline(x=52,  ymin= 0, ymax= 0.53, linestyle = ":", color = "grey")
plt.axhline(y=94, xmin= 0, xmax= 0.53, linestyle = ":", color = "grey")

plt.axvline(x=43,  ymin= 0, ymax= 0.44, linestyle = ":", color = "grey")
plt.axhline(y=75, xmin= 0, xmax= 0.44, linestyle = ":", color = "grey")

plt.text(38,60, '$E_1$', fontsize = 14, color = 'black')
plt.text(50,100, '$E_0$', fontsize = 14, color = 'black')
plt.text(-1,100, '$r_0$', fontsize = 12, color = 'black')
plt.text(-1,80, '$r_1$', fontsize = 12, color = 'C1')
plt.text(47,-10, '$Y_0$', fontsize = 12, color = 'black')
plt.text(38,-10, '$Y_1$', fontsize = 12, color = 'C1')

plt.text(69, 52, '←', fontsize=15, color='grey')
plt.text(46, 15, '←', fontsize=15, color='grey')
plt.text(10, 82, '↓', fontsize=15, color='grey')

# Título, ejes y leyenda
ax.set(title="Disminución en el Gasto de Gobierno", xlabel= r'Y', ylabel= r'r')
ax.legend()

plt.show()
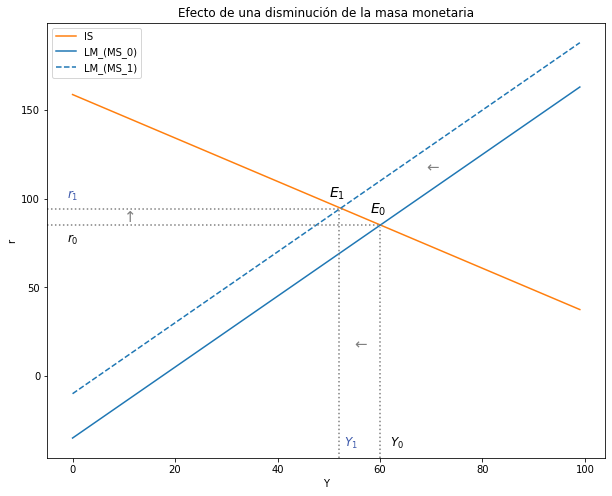
4.4.2. Analice los efectos sobre las variables endógenas a partir de una disminución masa monetaria \((∆M^s < 0)\)#
Intuición:
Matemática:
# nombrar variables como símbolos
Co, Io, Go, Xo, h, r, b, m, t, beta_0, beta_1  = symbols('Co Io Go Xo h r b m t beta_0, beta_1')

# nombrar variables como símbolos
k, j, Ms, P, Y = symbols('k j Ms P Y')

# Beta_0 y beta_1
beta_0 = (Co + Io + Go + Xo)
beta_1 = ( 1-(b-m)*(1-t) )

# Producto de equilibrio y la tasa de interes de equilibrio en el modelo IS-LM
r_eq = (k*beta_0)/(k*h + j*beta_1) - ( beta_1 / (k*h + j*beta_1) )*(Ms/P)
Y_eq = (j*beta_0)/(k*h + j*beta_1) + ( h / (k*h + j*beta_1) )*(Ms/P)
df_Y_eq_Ms = diff(Y_eq, Ms)
print("El Diferencial del Producto con respecto al diferencial de la masa monetaria = ", df_Y_eq_Ms)  # este diferencial es positivo
El Diferencial del Producto con respecto al diferencial de la masa monetaria = h/(P*(h*k + j*(-(1 - t)*(b - m) + 1)))
¿\(∆Y\) sabiendo que \(∆M^s < 0\)?
df_r_eq_Ms = diff(r_eq, Ms)
print("El Diferencial de la tasa de interés con respecto al diferencial de la masa monetaria = ", df_r_eq_Ms)  # este diferencial es negativo
El Diferencial de la tasa de interés con respecto al diferencial de la masa monetaria = -(-(1 - t)*(b - m) + 1)/(P*(h*k + j*(-(1 - t)*(b - m) + 1)))
¿\(∆r\) sabiendo que \(∆M^s < 0\)?
Gráfico:
#1--------------------------------------------------
    # Curva IS ORIGINAL

# Parámetros

Y_size = 100

Co = 35
Io = 40
Go = 50
Xo = 2
h = 0.8
b = 0.5
m = 0.4
t = 0.8

Y = np.arange(Y_size)


# Ecuación
def r_IS(b, m, t, Co, Io, Go, Xo, h, Y):
    r_IS = (Co + Io + Go + Xo - Y * (1-(b-m)*(1-t)))/h
    return r_IS

r = r_IS(b, m, t, Co, Io, Go, Xo, h, Y)


#2--------------------------------------------------
    # Curva LM ORIGINAL

# Parámetros

Y_size = 100

k = 2
j = 1
Ms = 700
P  = 20

Y = np.arange(Y_size)

# Ecuación

def i_LM( k, j, Ms, P, Y):
    i_LM = (-Ms/P)/j + k/j*Y
    return i_LM

i = i_LM( k, j, Ms, P, Y)
# Definir SOLO el parámetro cambiado
Ms = 200

# Generar nueva curva LM con la variacion del Ms
def i_LM_Ms( k, j, Ms, P, Y):
    i_LM = (-Ms/P)/j + k/j*Y
    return i_LM

i_Ms = i_LM_Ms( k, j, Ms, P, Y)
# Dimensiones del gráfico
y_max = np.max(i)
fig, ax = plt.subplots(figsize=(10, 8))

# Curvas a graficar
ax.plot(Y, r, label = "IS", color = "C1") #IS_orginal
ax.plot(Y, i, label="LM_(MS_0)", color = "C0")  #LM_original

ax.plot(Y, i_Ms, label="LM_(MS_1)", color = "C0", linestyle = 'dashed')  #LM_modificada

# Lineas de equilibrio_0
plt.axvline(x=60,  ymin= 0, ymax= 0.53, linestyle = ":", color = "grey")
plt.axhline(y=85, xmin= 0, xmax= 0.6, linestyle = ":", color = "grey")

# Lineas de equilibrio_1
plt.axvline(x=52,  ymin= 0, ymax= 0.57, linestyle = ":", color = "grey")
plt.axhline(y=94, xmin= 0, xmax= 0.53, linestyle = ":", color = "grey")

# Textos ploteados
plt.text(58,92, '$E_0$', fontsize = 14, color = 'black')
plt.text(50,101, '$E_1$', fontsize = 14, color = 'black')
plt.text(-1,75, '$r_0$', fontsize = 12, color = 'black')
plt.text(62,-40, '$Y_0$', fontsize = 12, color = 'black')
plt.text(-1,100, '$r_1$', fontsize = 12, color = '#3D59AB')
plt.text(53,-40, '$Y_1$', fontsize = 12, color = '#3D59AB')

plt.text(69, 115, '←', fontsize=15, color='grey')
plt.text(55, 15, '←', fontsize=15, color='grey')
plt.text(10, 87, '↑', fontsize=15, color='grey')

# Título, ejes y leyenda
ax.set(title="Efecto de una disminución de la masa monetaria", xlabel= r'Y', ylabel= r'r')
ax.legend()

plt.show()
4.4.3. A partir del siguiente sistema de ecuaciones que representa el modelo IS-LM#
Mercado de bienes:
Mercado de dinero:
4.4.3.1. Encuentre las ecuaciones de Ingreso \((Y^e)\) y tasa de interes \((r^e)\) de equilibrio#
Curva IS:
A partir de la nueva identidad Ingreso-Gasto: \( Y = C + I + G \)
La ecuación de la curva IS es:
Donde \(B_0 = C_0 + I_0 + G_0 \) y \( B_1 = 1- b(1-t) \)
Curva LM:
La ecuación de la curva LM es:
Equilibrio modelo IS-LM:
Para hallar \(Y^e\):
Para hallar \(r^e\):
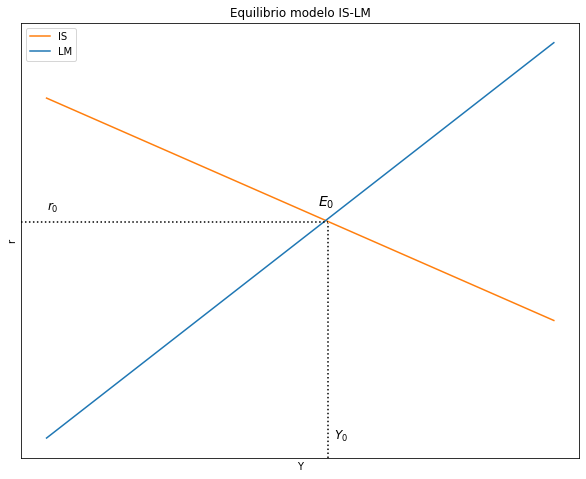
4.4.3.2. Grafique el equilibrio simultáneo en los mercados de bienes y de dinero#
#--------------------------------------------------
    # Curva IS

# Parámetros

Y_size = 100

Co = 35
Io = 40
Go = 50
h = 0.8
b = 0.5
t = 0.8

Y = np.arange(Y_size)


# Ecuación
def r_IS_2(b, t, Co, Io, Go, h, Y):
    r_IS_2 = (Co + Io + Go - Y * (1-b*(1-t)))/h
    return r_IS_2

r_2 = r_IS_2(b, t, Co, Io, Go, h, Y)


#--------------------------------------------------
    # Curva LM

# Parámetros

Y_size = 100

k = 2
j = 1
Ms = 200
P  = 20
π = 4

Y = np.arange(Y_size)

# Ecuación

def i_LM_2(k, j, Ms, P, Y, π):
    i_LM_2 = (-Ms/P)/j + k/j*Y - π
    return i_LM_2

i_2 = i_LM_2( k, j, Ms, P, Y, π)
    # Gráfico del modelo IS-LM

# Dimensiones del gráfico
y_max = np.max(i)
fig, ax = plt.subplots(figsize=(10, 8))

# Curvas a graficar
ax.plot(Y, r_2, label = "IS", color = "C1") #IS
ax.plot(Y, i_2, label="LM", color = "C0")  #LM

# Eliminar las cantidades de los ejes
ax.yaxis.set_major_locator(plt.NullLocator())
ax.xaxis.set_major_locator(plt.NullLocator())

# Texto y figuras agregadas
plt.axvline(x=55,  ymin= 0, ymax= 0.54, linestyle = ":", color = "black")
plt.axhline(y=94, xmin= 0, xmax= 0.55, linestyle = ":", color = "black")
plt.text(53,102, '$E_0$', fontsize = 14, color = 'black')
plt.text(0,100, '$r_0$', fontsize = 12, color = 'black')
plt.text(56,-15, '$Y_0$', fontsize = 12, color = 'black')

# Título, ejes y leyenda
ax.set(title="Equilibrio modelo IS-LM", xlabel= r'Y', ylabel= r'r')
ax.legend()

plt.show()
# nombrar variables como símbolos
Co, Io, Go, h, r, b, t, beta_0, beta_1  = symbols('Co, Io, Go, h, r, b, t, beta_0, beta_1')

# nombrar variables como símbolos
k, j, Ms, P, Y, π = symbols('k j Ms P Y π')

# Beta_0 y beta_1
beta_0 = (Co + Io + Go)
beta_1 = (1 - b*(1-t))

# Producto de equilibrio y la tasa de interes de equilibrio en el modelo IS-LM
r_eq = -(Ms/P)*(beta_1/(k*h+j*beta_1)) + ((k*beta_0)/k*h+j*beta_1) - ((beta_1*π)/k*h+j*beta_1)
Y_eq = ((j*beta_0)/(k*h+j*beta_1)) + (Ms/P)*(h/(k*h+j*beta_1)) + (j*h*π/(k*h+j*beta_1))
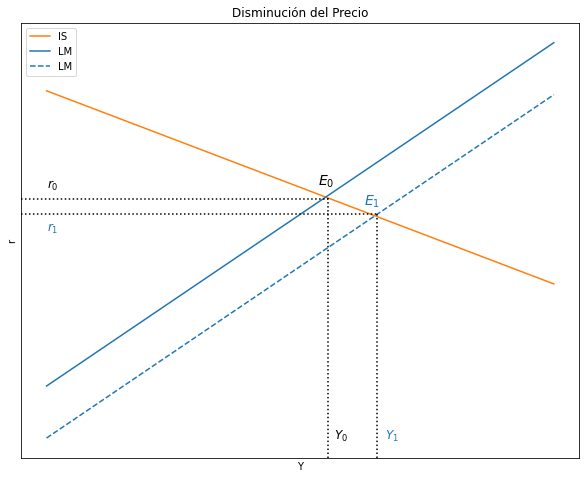
4.4.3.3. Analice los efectos sobre las variables endógenas Y, r de una disminución de los Precios \((∆P_0 < 0)\)#
Matemática:
# nombrar variables como símbolos
Co, Io, Go, h, r, b, t, beta_0, beta_1  = symbols('Co, Io, Go, h, r, b, t, beta_0, beta_1')

# nombrar variables como símbolos
k, j, Ms, P, Y, π = symbols('k j Ms P Y π')

# Beta_0 y beta_1
beta_0 = (Co + Io + Go)
beta_1 = (1 - b*(1-t))

# Producto de equilibrio y la tasa de interes de equilibrio en el modelo IS-LM
r_eq = -(Ms/P)*(beta_1/(k*h+j*beta_1)) + ((k*beta_0)/k*h+j*beta_1) - ((beta_1*π)/k*h+j*beta_1)
Y_eq = ((j*beta_0)/(k*h+j*beta_1)) + (Ms/P)*(h/(k*h+j*beta_1)) + (j*h*π/(k*h+j*beta_1))
df_Y_eq_P = diff(Y_eq, P)
print("El Diferencial del Producto con respecto al diferencial del nivel de precios = ", df_Y_eq_P)
El Diferencial del Producto con respecto al diferencial del nivel de precios = -Ms*h/(P**2*(h*k + j*(-b*(1 - t) + 1)))
¿\(∆Y\) sabiendo que \(∆P < 0\)?
df_r_eq_P = diff(r_eq, P)
print("El Diferencial de la tasa de interés con respecto al diferencial del nivel de precios = ", df_r_eq_P)
El Diferencial de la tasa de interés con respecto al diferencial del nivel de precios = Ms*(-b*(1 - t) + 1)/(P**2*(h*k + j*(-b*(1 - t) + 1)))
¿\(∆r\) sabiendo que \(∆P < 0\)?
Intuición:
#--------------------------------------------------
    # Curva IS

# Parámetros

Y_size = 100

Co = 35
Io = 40
Go = 50
h = 0.8
b = 0.5
t = 0.8

Y = np.arange(Y_size)


# Ecuación
def r_IS_2(b, t, Co, Io, Go, h, Y):
    r_IS_2 = (Co + Io + Go - Y * (1-b*(1-t)))/h
    return r_IS_2

r_2 = r_IS_2(b, t, Co, Io, Go, h, Y)


#--------------------------------------------------
    # Curva LM

# Parámetros

Y_size = 100

k = 2
j = 1
Ms = 200
P  = 20
π = 4

Y = np.arange(Y_size)

# Ecuación

def i_LM_2(k, j, Ms, P, Y, π):
    i_LM_2 = (-Ms/P)/j + k/j*Y - π
    return i_LM_2

i_2 = i_LM_2( k, j, Ms, P, Y, π)


#--------------------------------------------------
    # Nueva curva LM

P = 5

# Ecuación

def i_LM_2(k, j, Ms, P, Y, π):
    i_LM_2 = (-Ms/P)/j + k/j*Y - π
    return i_LM_2

i_2_P = i_LM_2( k, j, Ms, P, Y, π)
    # Gráfico del modelo IS-LM

# Dimensiones del gráfico
y_max = np.max(i)
fig, ax = plt.subplots(figsize=(10, 8))

# Curvas a graficar
ax.plot(Y, r_2, label = "IS", color = "C1") #IS
ax.plot(Y, i_2, label="LM", color = "C0")  #LM
ax.plot(Y, i_2_P, label="LM", color = "C0", linestyle ='dashed')  #LM

# Eliminar las cantidades de los ejes
ax.yaxis.set_major_locator(plt.NullLocator())
ax.xaxis.set_major_locator(plt.NullLocator())

# Texto y figuras agregadas
plt.axvline(x=55,  ymin= 0, ymax= 0.6, linestyle = ":", color = "black")
plt.axhline(y=94, xmin= 0, xmax= 0.55, linestyle = ":", color = "black")
plt.text(53,102, '$E_0$', fontsize = 14, color = 'black')
plt.text(0,100, '$r_0$', fontsize = 12, color = 'black')
plt.text(56,-45, '$Y_0$', fontsize = 12, color = 'black')

plt.axvline(x=64.5,  ymin= 0, ymax= 0.56, linestyle = ":", color = "black")
plt.axhline(y=85, xmin= 0, xmax= 0.64, linestyle = ":", color = "black")
plt.text(62,90, '$E_1$', fontsize = 14, color = 'C0')
plt.text(0,75, '$r_1$', fontsize = 12, color = 'C0')
plt.text(66,-45, '$Y_1$', fontsize = 12, color = 'C0')

# Título, ejes y leyenda
ax.set(title="Disminución del Precio", xlabel= r'Y', ylabel= r'r')
ax.legend()

plt.show()
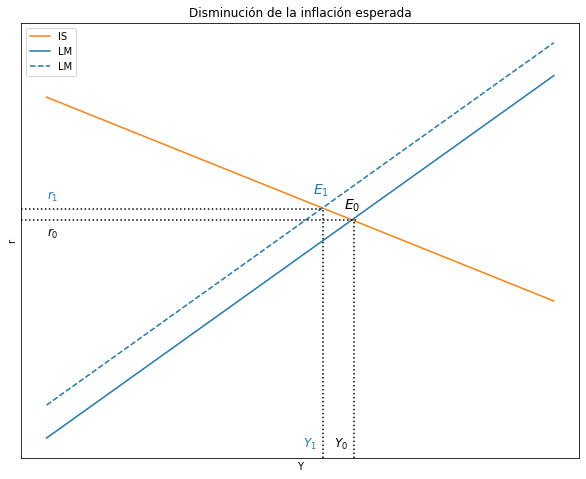
4.4.3.4. Analice los efectos sobre las variables endógenas Y, r de una disminución de la inflación esperada \((∆π < 0)\)#
Matemática:
# nombrar variables como símbolos
Co, Io, Go, h, r, b, t, beta_0, beta_1  = symbols('Co, Io, Go, h, r, b, t, beta_0, beta_1')

# nombrar variables como símbolos
k, j, Ms, P, Y, π = symbols('k j Ms P Y π')

# Beta_0 y beta_1
beta_0 = (Co + Io + Go)
beta_1 = (1 - b*(1-t))

# Producto de equilibrio y la tasa de interes de equilibrio en el modelo IS-LM
r_eq = -(Ms/P)*(beta_1/(k*h+j*beta_1)) + ((k*beta_0)/k*h+j*beta_1) - ((beta_1*π)/k*h+j*beta_1)
Y_eq = ((j*beta_0)/(k*h+j*beta_1)) + (Ms/P)*(h/(k*h+j*beta_1)) + (j*h*π/(k*h+j*beta_1))
df_Y_eq_π = diff(Y_eq, π)
print("El Diferencial del Producto con respecto al diferencial del nivel de inflación = ", df_Y_eq_π)
El Diferencial del Producto con respecto al diferencial del nivel de inflación = h*j/(h*k + j*(-b*(1 - t) + 1))
¿\(∆Y\) sabiendo que \(∆π < 0\)?
df_r_eq_π = diff(r_eq, π)
print("El Diferencial de la tasa de interés con respecto al diferencial del nivel de inflación = ", df_r_eq_π)
El Diferencial de la tasa de interés con respecto al diferencial del nivel de inflación = -h*(-b*(1 - t) + 1)/k
¿\(∆r\) sabiendo que \(∆π < 0\)?
Intuición:
#--------------------------------------------------
    # Curva IS

# Parámetros

Y_size = 100

Co = 35
Io = 40
Go = 50
h = 0.8
b = 0.5
t = 0.8

Y = np.arange(Y_size)


# Ecuación
def r_IS_2(b, t, Co, Io, Go, h, Y):
    r_IS_2 = (Co + Io + Go - Y * (1-b*(1-t)))/h
    return r_IS_2

r_2 = r_IS_2(b, t, Co, Io, Go, h, Y)


#--------------------------------------------------
    # Curva LM

# Parámetros

Y_size = 100

k = 2
j = 1
Ms = 200
P  = 20
π = 20

Y = np.arange(Y_size)

# Ecuación

def i_LM_2(k, j, Ms, P, Y, π):
    i_LM_2 = (-Ms/P)/j + k/j*Y - π
    return i_LM_2

i_2 = i_LM_2( k, j, Ms, P, Y, π)


#--------------------------------------------------
    # Nueva curva LM

π = 2

# Ecuación

def i_LM_2(k, j, Ms, P, Y, π):
    i_LM_2 = (-Ms/P)/j + k/j*Y - π
    return i_LM_2

i_2_π = i_LM_2( k, j, Ms, P, Y, π)
    # Gráfico del modelo IS-LM

# Dimensiones del gráfico
y_max = np.max(i)
fig, ax = plt.subplots(figsize=(10, 8))

# Curvas a graficar
ax.plot(Y, r_2, label = "IS", color = "C1") #IS
ax.plot(Y, i_2, label="LM", color = "C0")  #LM
ax.plot(Y, i_2_π, label="LM", color = "C0", linestyle ='dashed')  #LM

# Eliminar las cantidades de los ejes
ax.yaxis.set_major_locator(plt.NullLocator())
ax.xaxis.set_major_locator(plt.NullLocator())

# Texto y figuras agregadas
plt.axvline(x=54,  ymin= 0, ymax= 0.57, linestyle = ":", color = "black")
plt.axhline(y=95, xmin= 0, xmax= 0.54, linestyle = ":", color = "black")
plt.text(52,103, '$E_1$', fontsize = 14, color = 'C0')
plt.text(0,100, '$r_1$', fontsize = 12, color = 'C0')
plt.text(50,-35, '$Y_1$', fontsize = 12, color = 'C0')

plt.axvline(x=60,  ymin= 0, ymax= 0.55, linestyle = ":", color = "black")
plt.axhline(y=89, xmin= 0, xmax= 0.6, linestyle = ":", color = "black")
plt.text(58,95, '$E_0$', fontsize = 14, color = 'black')
plt.text(0,80, '$r_0$', fontsize = 12, color = 'black')
plt.text(56,-35, '$Y_0$', fontsize = 12, color = 'black')

# Título, ejes y leyenda
ax.set(title="Disminución de la inflación esperada", xlabel= r'Y', ylabel= r'r')
ax.legend()

plt.show()
